
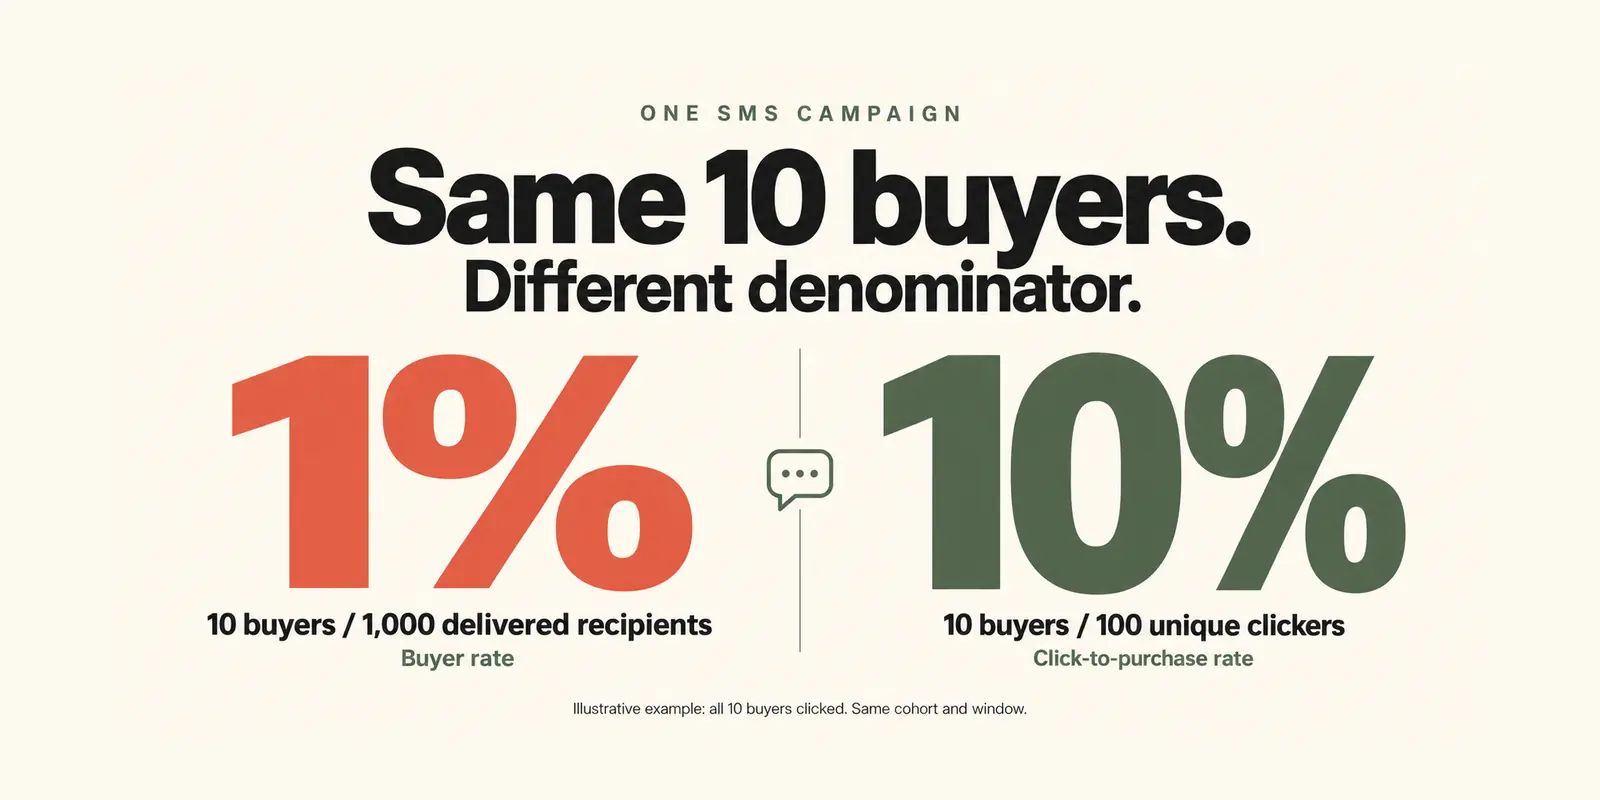


SMS marketing analytics is the practice of measuring how a text message moves from delivery to click to order, and what that cost, so you can decide what to change in your next send. For a Shopify store, a result only means something once you know three things about it: its denominator, its attribution window and rule, and its cost scope.
Key Takeaways
- Check the denominator first. People, messages, clicks and orders are different bases, and the same send can produce a 1% rate or a 10% rate depending on which one you divide by.
- Separate the attribution rule (which orders qualify) from the attribution window (how long the platform keeps looking). Both change reported revenue.
- Reported ROI measures revenue against a defined slice of cost. It is not profit. Net contribution is the figure to budget against.
- Do not use open rate as a core SMS metric. Track delivery, clicks, replies, orders, revenue and opt-outs.
- Use external benchmarks to raise questions and your own baseline, calculated the same way each month, to decide what to change.

Most guides give you a list of metrics and a benchmark for each. That is where the trouble starts. Two reports can show a “conversion rate” more than ten times apart and both be correct, because they divide by different things. A dashboard can show strong revenue from a text the shopper never clicked, because the window counted an order that would have happened anyway.
This guide gives you three checks to run before you trust any SMS number, a reference table for the metrics worth tracking, and a way to turn each one into a decision. It also covers why your SMS dashboard and Shopify disagree, how reported ROI differs from profit, and how to set up tracking so the numbers you compare are comparable.
Three checks before you trust any SMS number
Run these on every figure, whether it comes from your dashboard, a competitor’s blog or a benchmark report.
1. Denominator. Name the unit. People, messages, clicks and orders are four different bases. Revenue per recipient divides by people. Revenue per message divides by messages, and the two drift apart as soon as one shopper receives several texts. A “conversion rate” might divide by delivered messages or by unique clickers. Until you know which, you cannot compare it with anything.
2. Window and rule. Two settings decide whether an order counts as SMS revenue. The rule says which orders qualify, for example every order after a message, or only orders tied to a link click or discount code. The window says how long after the message or click an order still counts. Change either one and the same sends produce different revenue.
3. Cost scope. Attributed revenue is not profit. Reported ROI uses whichever costs the platform includes, and a full view adds the ones it leaves out: carrier and platform fees, discounts you gave and the cost of the product you shipped.
Once a number passes those checks, put it to work by asking which of four questions it answers. Is the message reaching people (delivery rate, opt-out rate, net list growth)? Is it engaging them (click-through rate, replies)? Is it earning (orders, revenue per recipient, average order value, reported ROI)? Is it profitable (net contribution per send)? Every metric in the next section is tied to one of those questions and to an action.
The SMS metrics worth tracking, with their denominators
The table states each metric’s formula and unit so you can match it against any report you read. Percentage rates are multiplied by 100. The unit column reads numerator over denominator, so “people over messages” means a count of people divided by a count of messages. Where vendors define a metric differently, use the definition here and note it when you compare.
For a practical review of permission, targeting, overlapping sends and unanswered replies, use our SMS marketing mistakes checklist.
| Metric | Formula | Unit | What it tells you | Check when it moves |
| Delivery rate | Delivered messages ÷ sent messages × 100 | Messages | Whether texts reach phones | List quality, consent, sender setup, carrier filtering |
| Click-through rate | Unique clickers ÷ delivered messages × 100 | People over messages | Whether the message and offer earn a visit | Audience, offer, link placement, message length |
| Reply rate | Shoppers who replied ÷ delivered messages × 100, excluding STOP | People over messages | Whether the message starts a conversation | Questions in the replies, handoff speed |
| Order rate | Attributed orders ÷ delivered messages × 100 | Orders over messages | Orders earned per message sent | Attribution settings, landing page, offer |
| Click-to-purchase rate | Unique attributed buyers who clicked ÷ unique clickers × 100 | People over people | How well the page converts the people who clicked | Landing page, price, shipping, checkout |
| Buyer rate | Unique attributed buyers ÷ unique delivered recipients × 100 | People over people | Share of your audience that bought | Segment mix, send frequency |
| Revenue per recipient | Attributed revenue ÷ unique recipients | Dollars per person | What each person on a send is worth | Segment, offer, window |
| Revenue per message | Attributed revenue ÷ delivered messages | Dollars per message | Value of each text sent. Differs from revenue per recipient when people get several texts | Send frequency, flow length |
| Average order value | Attributed revenue ÷ attributed orders | Dollars per order | Whether discounts or bundles change basket size | Offer design, free-shipping threshold |
| Opt-out rate | Unique opt-outs ÷ delivered messages × 100, per send | People over messages | Fatigue, relevance, consent quality | Frequency, targeting, how people joined the list |
| Net list growth | (New subscribers – opt-outs) ÷ list size at start × 100 | People over people | Whether the list grows faster than it leaks | Sign-up sources, opt-out spikes |
| Reported ROI | (Attributed revenue – platform-defined spend) ÷ that spend | Ratio | A defined, revenue-based return, not profit | Attribution window and rule, which costs are counted |
| Net contribution per send | Attributed revenue – the send costs you include – product cost | Dollars | Whether a send made money | Discounts, product margin, fees outside reported ROI |
Open rate is missing on purpose. Standard SMS has no open tracking, so any figure is an estimate built from clicks or replies, and it is not comparable between platforms. Delivery is not attention, so a very high delivery figure says nothing about whether anyone read the text. Track clicks and replies instead, and treat a platform’s “open” number, if it shows one, as secondary.
Why your numbers differ from every benchmark
Published SMS benchmarks disagree by large margins, and the denominator explains most of the gap. Here is what two current sources report, with the basis each one gives.
| Source | Metric | Reported | Basis stated |
| Klaviyo SMS benchmarks (published January 23, 2026, modified September 24, 2026) | Average click rate | 5.6% campaigns, 9.65% flows | Over 183,000 Klaviyo customers. Collection period and formula not stated |
| Klaviyo, same page | Average order rate | 0.27% campaigns, 1.9% flows | Formula not stated |
| PushOwl metrics guide (June 4, 2026) | Conversion rate | 5-15% promotional, 15-30% triggered | Attributed orders ÷ clicks within the attribution window. No source named |
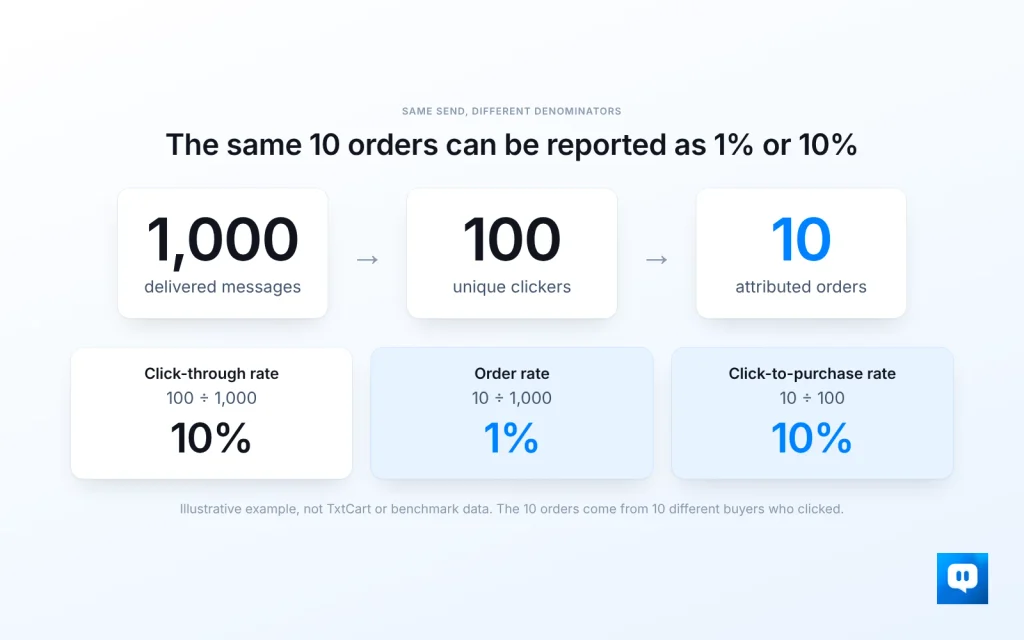
A 0.27% order rate and a 5% conversion rate sound like different worlds. Take an illustrative send of 1,000 delivered messages and 100 unique clickers, with 10 attributed orders from 10 different buyers who clicked. The click-through rate is 10%. The order rate is 1% of delivered messages. The click-to-purchase rate is 10% of clickers. Ten orders, and the same send can be reported as 1% or 10%.
Use benchmarks for context and your own history for decisions. Pull your last 90 days under one set of definitions, then judge each send against that baseline. For benchmark detail by industry and campaign type, see our SMS conversion rate guide. For broader market figures, see text marketing statistics.
Attribution rules, windows and why your dashboard disagrees with Shopify
Attribution answers one question: which orders get credited to a text. The rule decides which kinds of orders qualify. The window decides how long after the message or click an order can still count. Both are settings, and both change your revenue figure without changing a single shopper’s behavior.
TxtCart documents its settings in the Help Center. Rules can be set for the whole account, for a single flow, or for one message node, and each deeper level can only be stricter than the one above it. Flows can use All Conversions, Discount/Link Clicked, or None. Campaigns can use All Conversions or None, because Discount/Link Clicked is not available for campaigns. The windows are configurable in your messaging settings. TxtCart’s attribution guide describes the controls, and its ROI article notes that a broader window credits more orders and raises reported ROI, while a stricter one lowers it. Keep your settings consistent over time so trends stay comparable.
Here is an illustrative example. A shopper receives a text at 9:00 a.m. on Monday, clicks the link at 9:05, and buys on Thursday at 4:00 p.m. Under a 1-day window that order is not SMS revenue. Under a 7-day window it is. Run the same campaign under each and you get two different revenue figures from identical behavior. If you compare your numbers with another store’s, or with last quarter’s, make sure the windows match first.
Why your SMS dashboard and Shopify rarely agree:
- The SMS platform credits orders by its own attribution model, while Shopify reports orders and sales by its own rules.
- The windows differ, or one tool counts an order after a message is received and the other only after a click.
- Order exclusions differ, such as tags, test orders or draft orders.
- Time zones differ, or one report dates revenue by send date and the other by order date.
- Refunds and cancellations land in different periods.
Do not add up the attributed revenue from your SMS tool, your email tool and your ad platforms and call the total store revenue. Each tool credits the same order to itself. Instead, take a sample of orders from one day and trace each through Shopify, your SMS platform and analytics. Differences you can explain are fine. Differences you cannot are the ones to chase.
From attributed revenue to profit
Three different numbers get called ROI. Keep them apart.
Attributed revenue is the order value your attribution rules and window credit to SMS. Reported ROI measures that revenue against a defined slice of cost. Net contribution is what is left after the costs you choose to include, such as product cost, fees outside reported ROI, and any other variable costs. Only the third tells you whether a send made money.
TxtCart’s dashboard ROI uses Marketing Spend, which is the spend tied to your campaigns and flows: messaging fees plus campaign fees. It leaves out carrier, platform, service and AI resolution fees. The formula, per the TxtCart Help Center, is:
ROI = (Total Attributed Revenue – Marketing Spend) ÷ Marketing Spend
It appears on the Home screen and on the Flows and Campaigns screens. Merchants who signed up before January 18, 2026 and remain on performance-based billing have transaction fees for recovered orders counted in their total SMS costs, so check how your own account’s costs are defined before comparing.
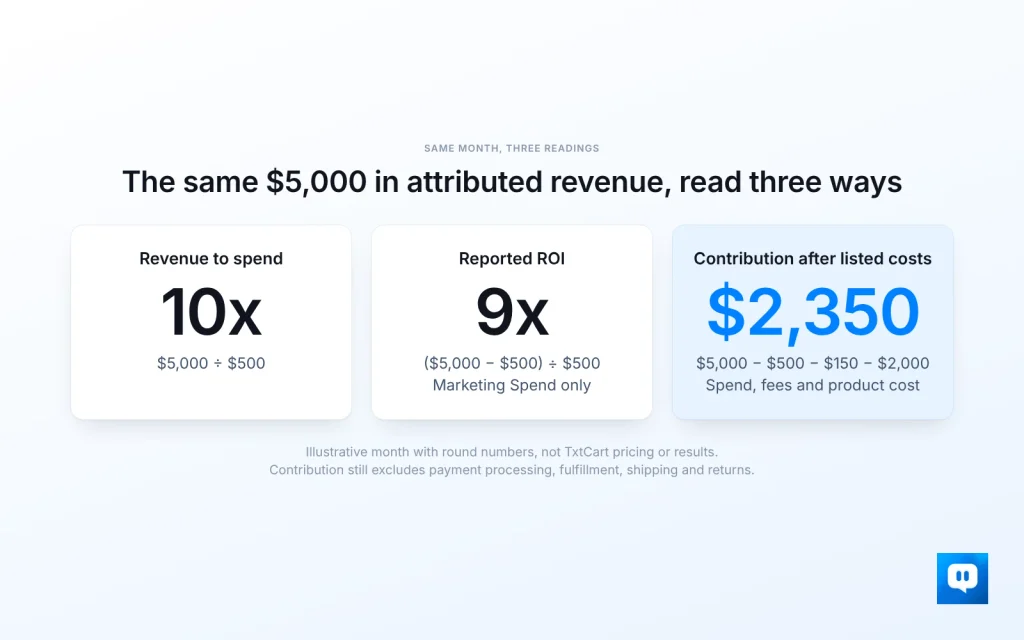
Here is an illustrative month with round numbers, not TxtCart pricing or results. Attributed revenue is $5,000, already net of discount codes, so you do not subtract discounts a second time. Marketing Spend is $500.
Reported ROI is ($5,000 – $500) ÷ $500 = 9, or 9x (900%). That is not the same as the 10x you get by dividing revenue by spend.
Now add costs the dashboard leaves out: $150 in carrier and platform fees, and product cost at 40% of revenue, or $2,000. Contribution after those listed costs is $5,000 – $500 – $150 – $2,000 = $2,350. Against total SMS cost of $650, that is about $3.62 of contribution per $1 spent. This still leaves out payment processing, fulfillment, shipping, returns and any other variable costs you bear, so subtract those too before calling it profit. It is a long way from 9x, and a better basis for budgeting.
One more limit. Attributed orders include shoppers who would have bought anyway. Reported ROI and net contribution both describe credited orders, not proven lift. Only a holdout test, where a comparable group receives no messages, measures what SMS added.
To run your own numbers, use our SMS ROI calculator. For ways to raise the return once you can measure it, see how to drive more SMS marketing ROI from campaigns.
When a metric moves: what to check
A number is only useful if it points to an action. Pair each combination of movements with the first thing to check, and change one thing at a time so you can tell what worked. Compare flows with flows and broadcasts with broadcasts. A welcome flow and a Black Friday blast reach different audiences at different moments, so one is not a baseline for the other.
| What you see | Likely cause | Check first | Next move |
| High delivery rate, low click-through rate | Weak offer, wrong audience, buried link | Segment, message copy, link placement | Test one change. See SMS A/B testing examples |
| High click-through rate, low orders | Friction after the click | Landing page, price, shipping, checkout, window setting | Fix the page before the message. See Shopify post-click friction |
| High reply rate, low purchase rate | Shoppers have questions the text does not answer | Themes in replies, response speed, product page gaps | Answer the common question in the next message or on the page |
| Revenue up, opt-outs up | Short-term gain from frequency or broad targeting | Opt-out rate by segment and by send | Narrow the audience or cut frequency before the list shrinks |
| Low delivery rate | List quality, consent, sender setup, carrier filtering | New sign-up sources, bounced numbers, sender status | Clean the list. See SMS list cleaning for Shopify |
| Revenue jumped but orders did not | Higher order value or a different product mix, or a window or rule was widened, or an exclusion removed | Average order value, product mix, attribution settings history, order exclusions | Annotate any settings change, keep unlike periods separate, and recalculate only where you have the data |
| One segment far above the rest | Buyers already close to purchase | Whether the segment was already engaged before the text | Use segmentation to test who needs the text, not who would buy anyway |
Tracking SMS revenue in a Shopify store
Follow the same sequence every time, so a number from March means the same thing as one from October.
1. Fix the reporting period and the units. Decide whether you report by send date or order date, and state whether each rate divides by people, messages or clicks.
2. Confirm every link in a text is tracked. Open a live text on a phone and follow the shortened link through to checkout.
3. Use consistent UTM parameters on links you control. An illustrative convention is utm_source=txtcart, utm_medium=sms and utm_campaign set to the campaign name. Do not append a second set of parameters to a link that already carries them, and never put customer details in a URL.
4. Check how Google Analytics 4 groups the traffic. GA4 assigns sessions to its SMS default channel group when the source or the medium exactly matches “sms” (not case-sensitive), per Google’s documentation. A source of “txtcart” with a medium of “sms” qualifies.
5. Review your attribution settings and exclusions, then record them with the date. A change in either explains a jump in revenue better than any campaign does.
6. Compare campaigns and flows in separate reports.
7. Reconcile a sample of orders across Shopify, your SMS platform and GA4, as described above.
If you use TxtCart, trackable links automatically carry a utm_campaign parameter named for the flow or campaign, and any custom parameters you add pass through as entered. To exclude orders that should not count toward attributed revenue, such as wholesale or test orders, add their Shopify tags under Excluded Order Tags in Attribution Settings.Tag matching is case-sensitive, so enter each tag exactly as it appears in Shopify. The setting applies only to new orders going forward and does not change past data. You can find the full details in the TxtCart attribution guide.
How TxtCart puts the three checks to work
A revenue figure is only useful when you can see the rules behind it. TxtCart’s Insights and Analytics is built around that idea. Here is how it supports each of the three checks.
- Denominator: performance is broken out by flow, campaign and individual message, with message-level attribution, so you can match each figure to the denominators in the table above.
- Rule and window: you choose the attribution rule for the account, with stricter overrides for a flow or a message, and the window in account settings. That keeps the rule behind each figure visible.
- Cost scope: reported ROI uses Marketing Spend, which is messaging fees plus campaign fees. You add carrier, platform, service and AI resolution fees yourself for the all-in view.
The habit that matters is order of operations. Set your attribution rule and window deliberately, record them, read ROI as a defined revenue-based return, and compute net contribution outside the dashboard. That keeps the number you show your team from drifting when a setting changes.
Step-by-step setup is in the TxtCart attribution guide. To see revenue, flow, campaign and message-level reporting on your own store, explore Insights and Analytics. If you would rather walk through your numbers with someone, book a demo.
Shopper replies tell you what the numbers cannot
Clicks and orders show what shoppers did. Replies show why they hesitated. Read them once a week, and sort each into a theme: fit and sizing, shipping, offer eligibility, payment, or trust. Keep STOP messages and complaints in their own group, because they belong with your opt-out analysis, not with your sales questions.
Then compare the themes with the journey. If many replies ask whether a code works on sale items, the message or the landing page left that out. If shoppers keep asking about delivery dates, the answer belongs in the text or at checkout. A high reply count with few orders usually means the text starts conversations that the rest of the journey does not finish.
Speed matters here too. For triggered texts, the delay between the trigger and delivery is worth watching, because a reminder that lands late may reach a shopper who has already moved on. Check when each triggered text actually arrives and compare that with when you intended it to send.
A monthly SMS scorecard you can copy
Review list health weekly and revenue efficiency monthly. Copy the table into a spreadsheet, fill in this month and last month, and set your own baseline from the previous 90 days. The last column is a trigger you write down in advance, so the review ends in a decision. There are no universal thresholds here on purpose, because a good number depends on your list, your offers and your definitions.
| Metric | Unit | This month | Last month | Your 90-day baseline | Act when |
| Delivery rate | Delivered ÷ sent | Falls below baseline for two sends in a row | |||
| Click-through rate | Unique clickers ÷ delivered | Falls below baseline on a comparable send type | |||
| Click-to-purchase rate | Unique buyers who clicked ÷ unique clickers | Falls while click-through rate holds | |||
| Revenue per recipient | Revenue ÷ unique recipients | Falls below baseline for a core segment | |||
| Opt-out rate | Opt-outs ÷ delivered, per send | Rises against baseline after a frequency or targeting change | |||
| Net list growth | (New – opt-outs) ÷ starting list | Turns negative | |||
| Reported ROI | (Revenue – Marketing Spend) ÷ spend | Moves after an attribution change rather than a send change | |||
| Net contribution per send | Revenue – included costs – product cost | Turns negative on a send you planned to repeat | |||
| Attribution rule and window | Setting and date | Any change. Annotate the date and keep unlike periods separate |
SMS marketing analytics FAQ
What are the most important SMS marketing metrics?
Track delivery rate, click-through rate, order rate or click-to-purchase rate, revenue per recipient, opt-out rate and net contribution per send. Each answers a different question: whether texts arrive, earn clicks, produce orders, keep the list healthy and make money. State the denominator for every rate so you can compare it across reports.
Is SMS open rate a reliable metric?
No. Standard SMS has no open tracking, so any open figure is an estimate built from clicks or replies. Use click-through rate and reply rate to measure engagement.
What is a good SMS click-through rate?
It depends on the send type and how the source calculates it. Klaviyo’s 2026 benchmarks show an average click rate of 5.6% for campaigns and 9.65% for flows. Other published figures use different denominators from your own reports, so treat them as context. Compare your sends against your own last 90 days. For more benchmark detail, see our SMS conversion rate guide.
How do you calculate SMS marketing ROI?
Subtract your SMS spend from attributed revenue, then divide by the spend. TxtCart’s dashboard ROI uses Marketing Spend (messaging and campaign fees), so it leaves out carrier, platform, service and AI resolution fees. For profit, subtract every cost and product cost as well. Use the SMS ROI calculator to test your own figures.
What attribution window should I use for SMS?
Start from the customer journey. Look at how long shoppers usually take to buy after a click or a message in your store, and pick a window that covers most of those purchases. A longer window credits more orders and raises reported revenue and ROI, so keep the window fixed, record it next to every figure, and annotate the date you change it.
Where to go from here
Run the three checks on your last month of sends, copy the scorecard, and annotate any period that used a different attribution setting. To see the revenue, flow and campaign views in your own store, explore TxtCart Insights and Analytics, or use the SMS ROI calculator first if you are still building your measurement model.